


Detecting shrub encroachment in seminatural grasslands using UAS LiDAR

Interview:
Hi Bjarke, thank you for accepting this interview! We know you have used YellowScan Surveyor for your biodiversity research work. Can you tell us a bit more about you and your research work?
I am Bjarke Madsen from Aarhus University in Denmark. I have been a PHD Student for 3,5 years at Ecoinformatics and Biodiversity, Department of Biology. Here I am working with the Vegetation dynamics group @Vegdyn, and in the UAS4Ecology lab, @UAS4Ecology.
My research work is about understanding grassland diversity dynamics using drone-based remote sensing. I am involved in monitoring biodiversity by developing effective methods to conduct, process and analyze drone-based remote sensing data. I am trying to detect different elements of plant diversity through time and space.
We have used YellowScan Surveyor in the first part of my thesis “Detecting shrub encroachment in seminatural grasslands using UAS LiDAR” in collaboration with Urs A. Treier, András Zlinsky, Arko Lucieer and Signe Normand.
How did you use UAS LiDAR to detect shrubs?
YellowScan Surveyor UAS LiDAR was operated to scan a grassland area, where horses and cows have recently been re-introduced in a so-called rewilding experiment. We detected and monitored a specific shrub species (Cytisus scoparius or Scotch broom) that is problematic in some areas in terms of encroachment. The species is fast-growing and able to outcompete surrounding plants by monopolizing light, with possibly negative consequences for plant diversity. Therefore, we scanned the area and classified the shrub individuals in the UAS LiDAR pointcloud. We developed a set of 3D variables characterizing and distinguishing this species from other shrubs. The variables where targeted to detect morphological features varying between shrub species to represent for example leaf and branch arrangement. For example, our focal shrub (C. scoparius) has a less dense growth form as for example Juniperus communis, which therefore can be separated by the point-based variables representing light penetration and complexity.
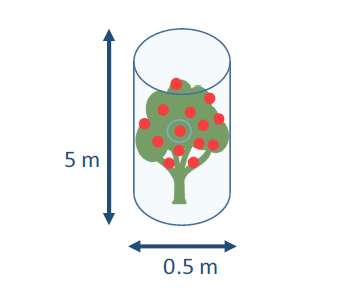
We used our ecological knowledge to make different variables best representing shrub growth features and then used a point-based machine learning technique to classify the different species directly in the 3D point cloud. We reached at least 86% of accuracy in our classification model. This high precision allowed us to calculate the biomass of our focal shrub and project these measures to the whole landscape of 6.7 ha.
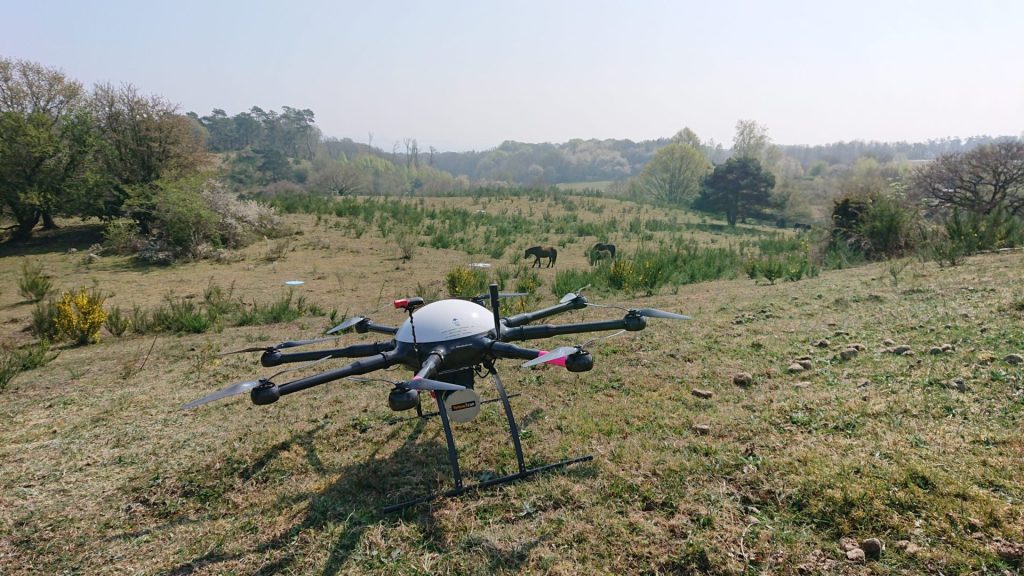
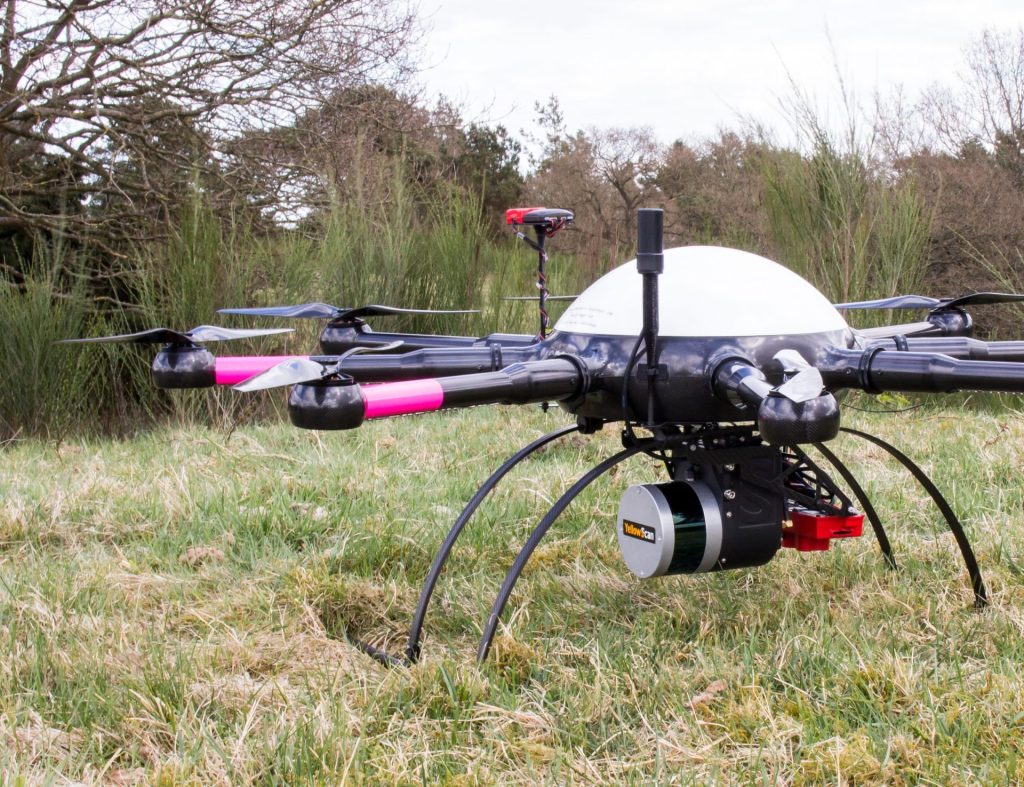
MikroKopter MK8-3500 UAS and YellowScan Surveyor in the area surveyed – Photo credit. Bjarke Madsen.
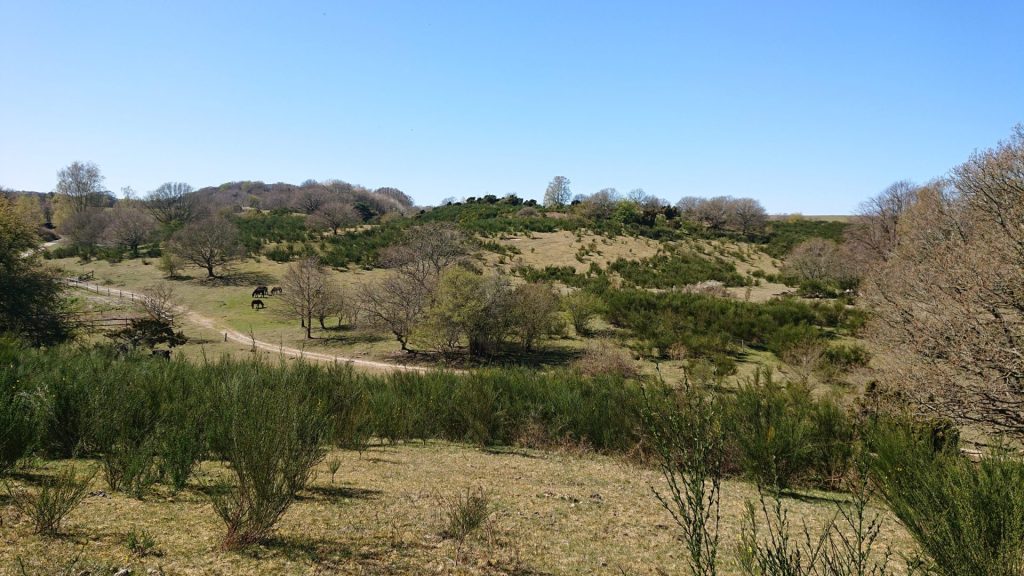
Wild landscape with shrubs and trees – Photo credit. Bjarke Madsen.
What were the first results?
We performed two flight campaigns in autumn 2017 and spring 2018 over the same area. This allowed us to study changes across the winter season as the animals are presumed to affect woody vegetation more during this period, while at the same time we would not expect much plant growth during this cold season. On average, we found, as expected, a decrease in biomass from autumn to spring, also only small (33.4 or 4.9 g/m2, depending on the classification model). However, the change of shrub biomass was not equally distributed throughout the area. In some areas, we found a large decrease of shrub biomass, especially in an area closer to the forest.
We have not yet spent time to investigate more on the underlying factors causing this decrease in biomass. Although, one hypothesis is that animals tend to spend more time in the forest during winter and thus affect the shrubs more in this area by trampling and browsing. But, as said, more research will be needed to test this hypothesis. On the other hand we also had areas with a small increase of shrub biomass, possibly due to early spring growth or warmer periods during winter.
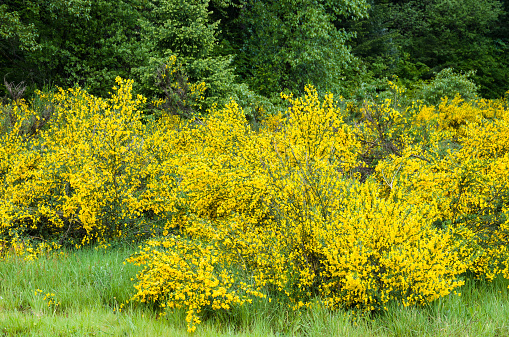
Cytisus Scoparius
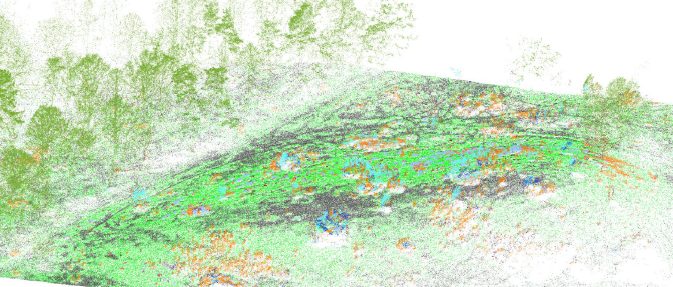
Classified UAV LiDAR pointcloud – Cytisus Scoparius
Madsen, Bjarke, et al. “Detecting shrub encroachment in seminatural grasslands using UAS LiDAR.” Ecology and Evolution (2020)
What about your data acquisition: area surveyed and number of flights?
In October 2017, we did one of our first flights with the YellowScan Surveyor. We did not aim at covering as much ground as possible but emphasized the level of detail needed for detecting small-scale variation in grassland vegetation. We collected LiDAR data with 3 flights, which is manageable in half a day. We flew relatively low, 40 meters above ground. With these settings we could map an area of 6.7 hectares.
Over the past view year we have well established the workflow and routines and are familiar with the process. My colleague Urs A. Treier is the UAS pilot, doing the heavy technical part and I have been the co-pilot with all flights doing the flight plans and monitoring the ground control station.
Currently we are doing more detailed temporal monitoring effort by repeating the UAS flights every 2 months. With the so acquired data we will be able to look more into the seasonal growth changes but also effects of phenological stages on LiDAR classifications.
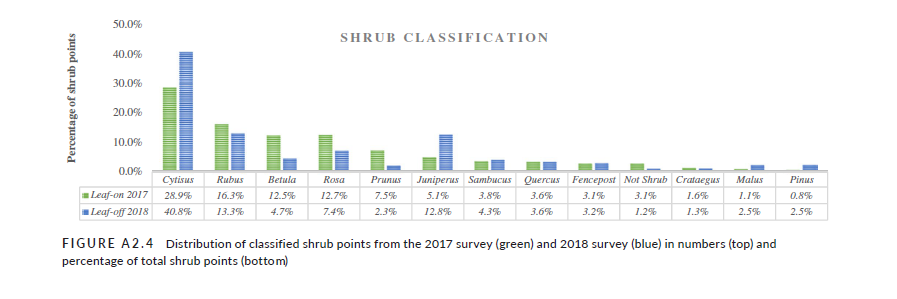
Distribution of classified shrub points from the 2017 survey (green) and 2018 survey (blue) in percentage of total shrub points. Madsen, Bjarke, et al. “Detecting shrub encroachment in seminatural grasslands using UAS LiDAR.” Ecology and Evolution (2020)
What about pointcloud data processing? What are the end-results in terms of accuracy?
Once the LiDAR pointcloud is generated with the YellowScan software, pointcloud manipulation was conducted with the OPALS software package, developped by TU Wien researchers. We used OPALS for semi-automatic point-based classification directly in the pointcloud, which means, that each point can be attributed with various additional features. Two major inputs were needed for the classification to work.
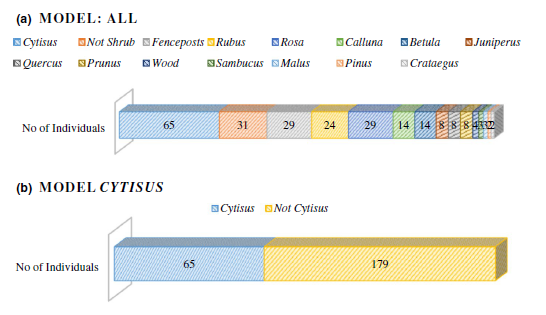
First, reference and validation data of 180 observations from 11 different shrub species were sampled manually across the area by measuring exact locations with a GNSS system.
Secondly, pointcloud variables could then be extracted for the now labelled shrubs. Subsequently, we applied a machine learning approach by using a recursive partitioning algorithm to classify each point in the pointcloud based on the morphological features represented by LiDAR variables.
The overall accuracy of the pointcloud classification was good, with overall accuracies of 86.9 % and 95.2 % for the autumn and spring data, respectively. We made some adjustments to align the pointclouds originating from the 3 different flights for combining data and obtaining a better representation of shrubs. The results are great. We are always way below 10 cm absolute precision, which is our requirement.
How would you describe your experience with YellowScan solutions?
When we purchased the system, we were looking for a ready to go turn key solution and that is what we got! Besides that, the Surveyor is doing its job well and it is straight forward to work with POSPac and YellowScan software. To be honest I do not remember major issues and I have postprocessed quite a bit of LiDAR data!
Our impression in the research team is that, even with 2 returns (or echoes) provided by the Surveyor, we get a lot of points and get a good representation of vegetation. Our data looks very good and accurate and we do not really see a lot of noise in the data outputs. Of course, we are looking at very fine scale vegetation features and do not apply the system in forestry.
Anything to add about UAS LiDAR mapping to detect vegetation?
We wanted to see what is actually possible in terms of spatial resolution for plant diversity studies. Working on grassland biodiversity it is about precision and accuracy. With UAS LiDAR we could really see the differences in the landscapes.
We use LiDAR on Drones because most of traditional land management activities is based on local plot scales. This does not necessarily represent what is happening in the whole landscape. That is what we showed in our study. In that sense, we were able to observe different trends: variation in biomass change across an area with increases and decrease. We would not have been able to capture such vegetation dynamics at a landscape scale without UAS LiDAR. Now, we can cover a larger area to monitor biodiversity which will assist nature management and conservation efforts.
Thank you for sharing this insight and the result of your research work. Good luck on defending your thesis!
NB: Author Julien BO.
